.png)
Understand what normality looks like
23 June 2026
Interested to know how you are doing? Come join the DIARY Study!
The DIARY study has gotten off to a strong start; we are now just over 110 participants recruited. Thank you to all who have participated. We trust you have found it useful to have insights into your metabolic health and risk of diabetes. We will kick off this post with an insight into continuous glucose monitoring (CGM) profiles!
Our pancreas usually does a beautiful job at producing insulin, just enough to match what we eat, to keep our glucose levels steady within a tight range. Unlike an oral glucose tolerance test (typical test for defining diabetes), a CGM is worn under habitual dietary and lifestyle conditions over several days. At the moment, the range at which we define normality on a CGM, across different populations, is unclear. This study will enable insights as to how we define normal versus early derangements in glucose levels, before diabetes is defined.
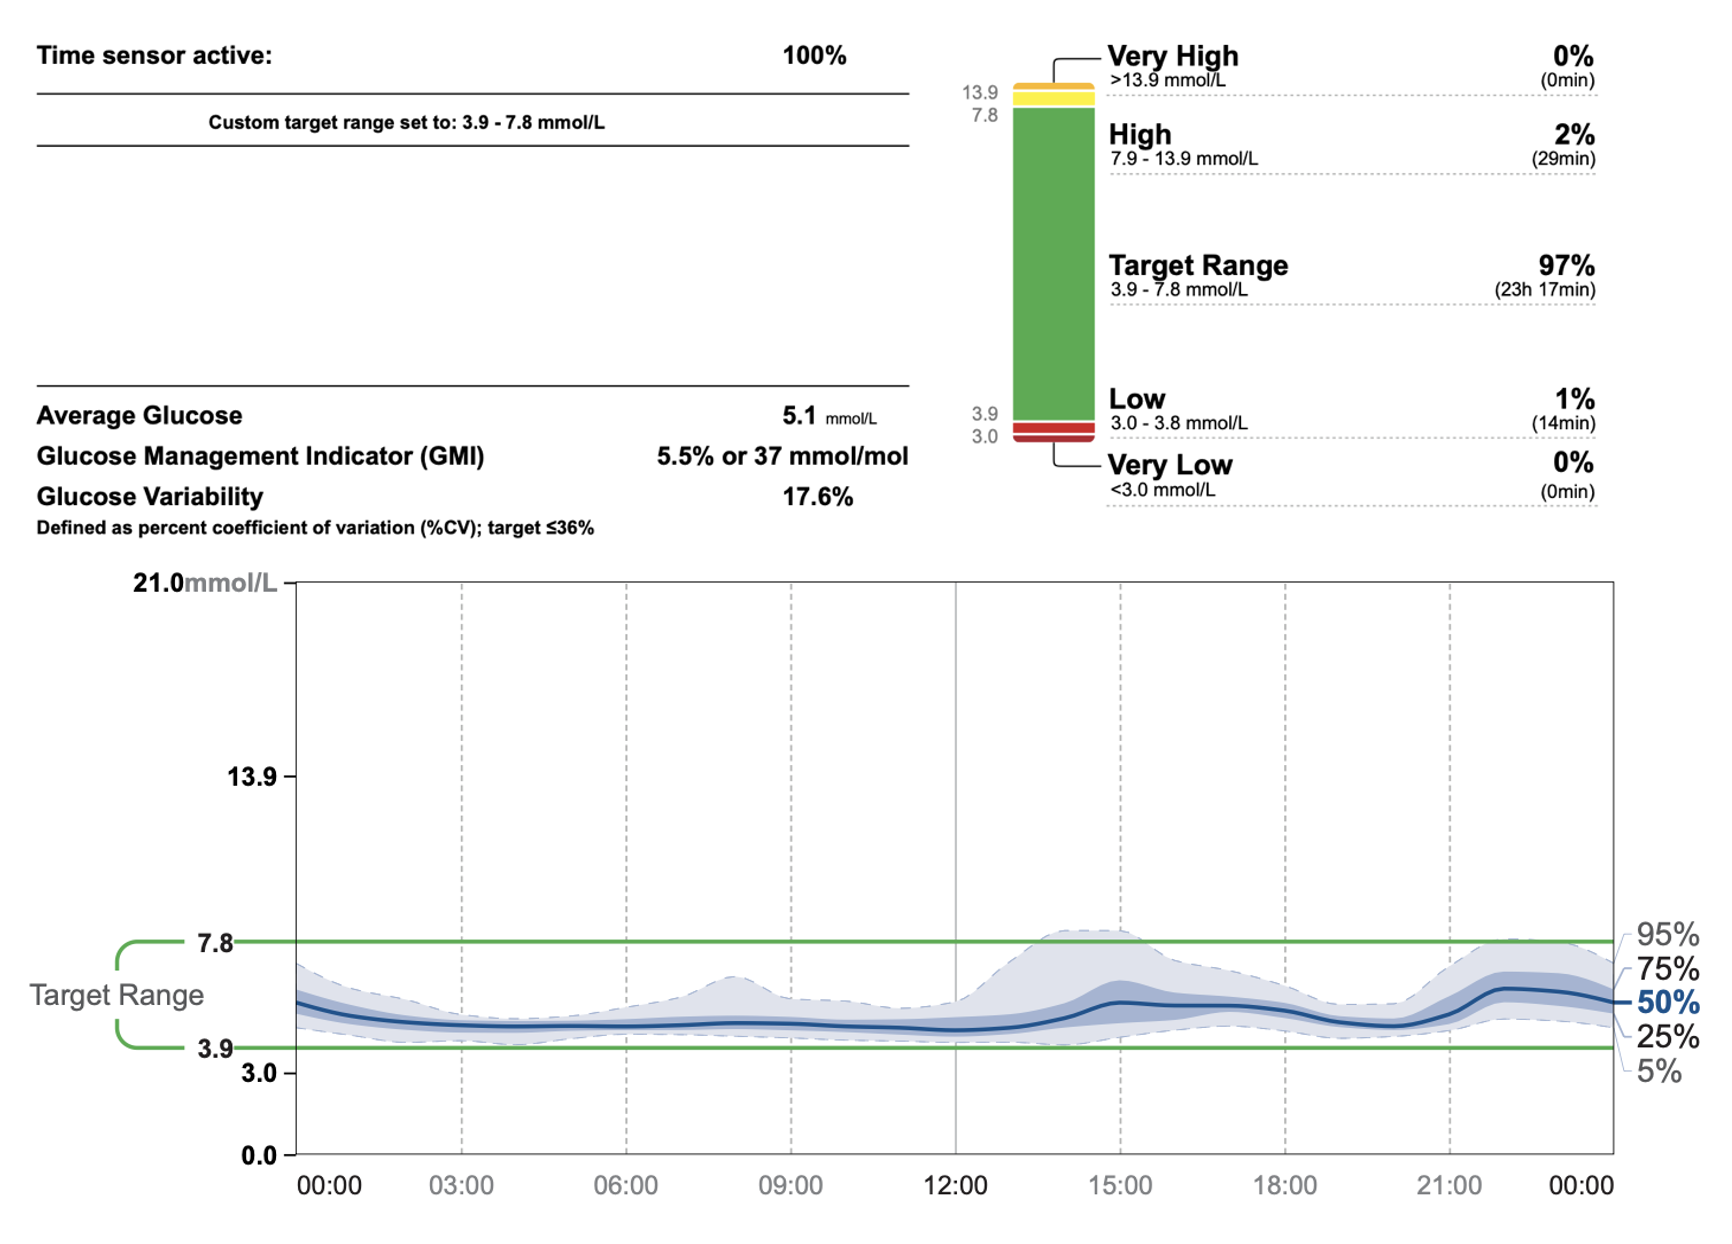
The figure below shows the CGM tracing of a person with normal glucose levels. This person is achieving 99% of the time within the range of 3.9 to 7.8 mmol/l. There is very little variability in the glucose level.